CUNY SPS IS 608 Final Projects
As part of the Master's Degree in Data Analytics at CUNY's School of Professional Studies, students complete class IS 608, an introduction to data visualization tools.
For their final project, students in IS 608 were assigned to create a public visualization using data relevant to a current policy, business, or justice issue. Students were encouraged to use any dataset they could find, as long as the data was either public or the student had permission from the data’s owner/administrator to work with it and share it.
Fall 2016
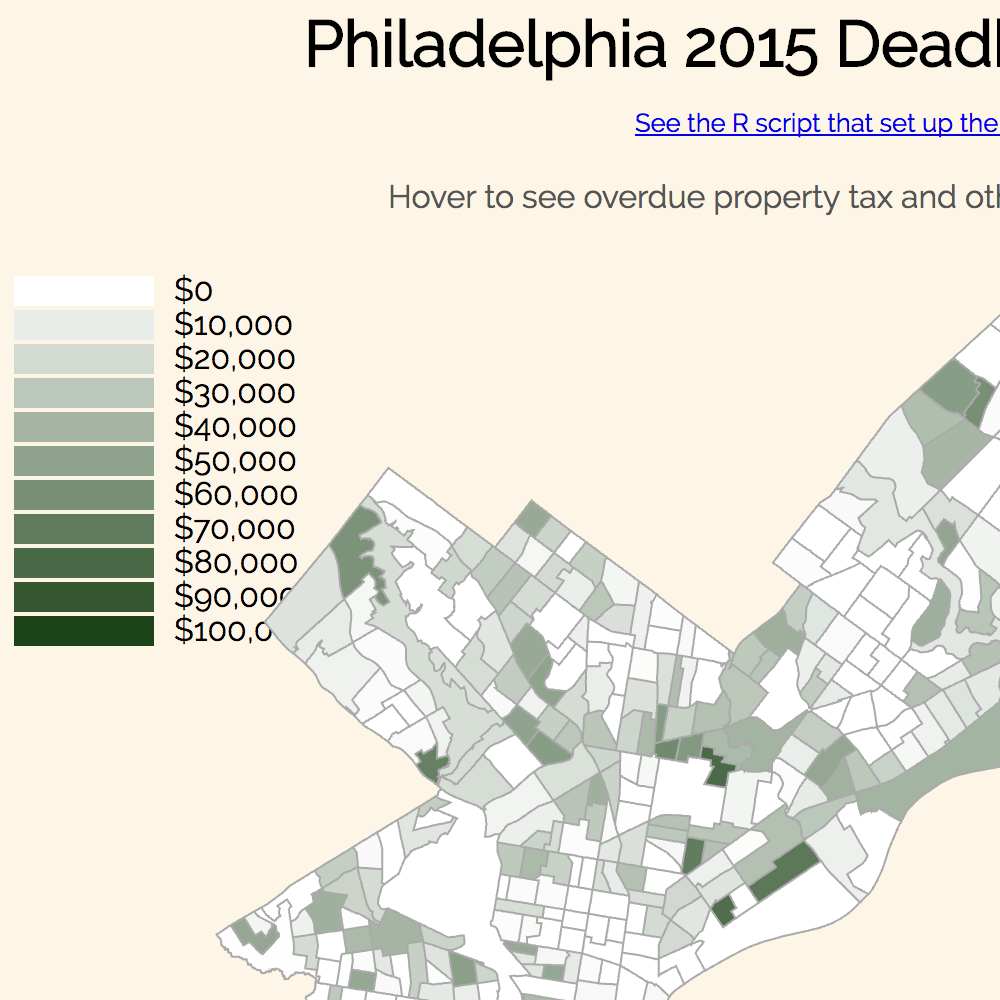
Joy Payton: Worst Philadelphia tax delinquents (D3, Google Charts)
Max Wagner: Track and field: records and doping (Shiny, ggplot)
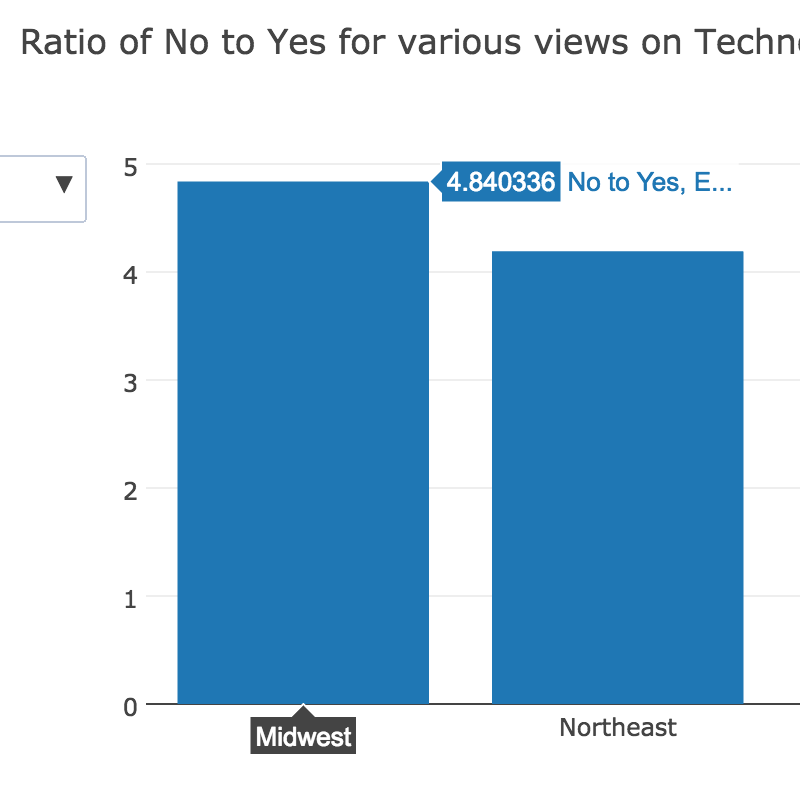
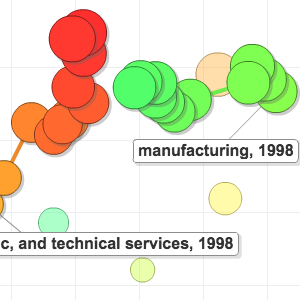
Christophe Hunt: US regional employment & views of technology (Plotly)
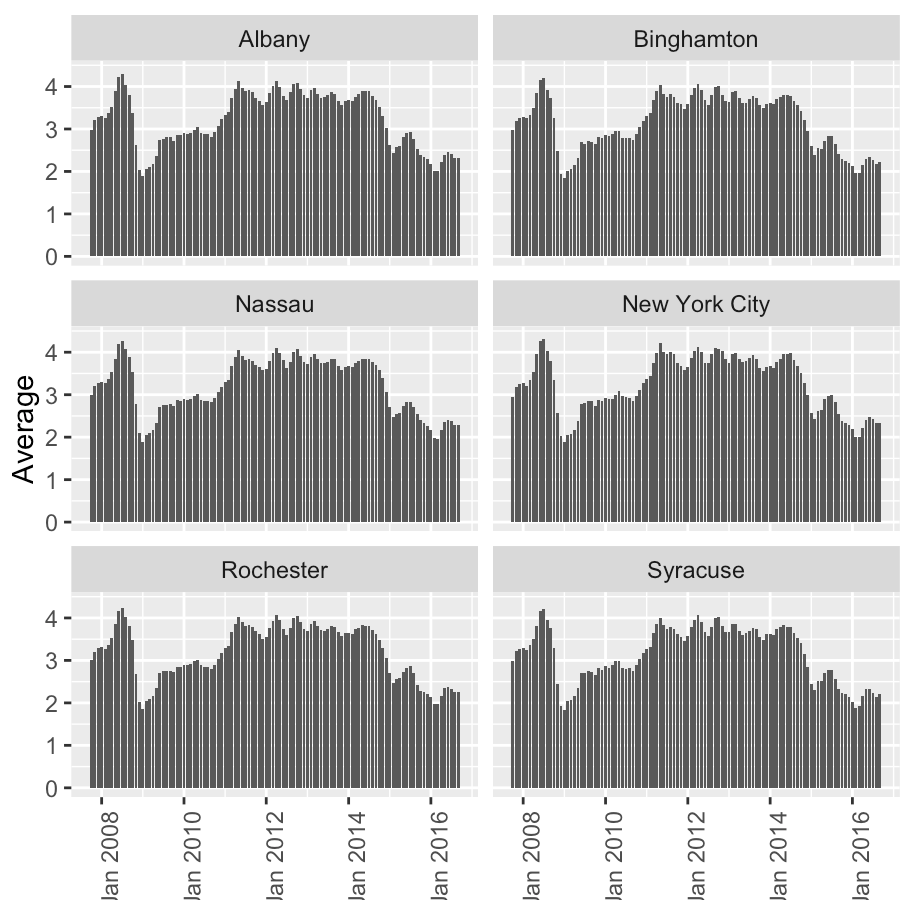
Yadu Chittampalli: Gasoline prices and income in New York State (ggplot)
Srinivasa Illapni: Pollution and respiratory diseases (ggplot, Google Charts)
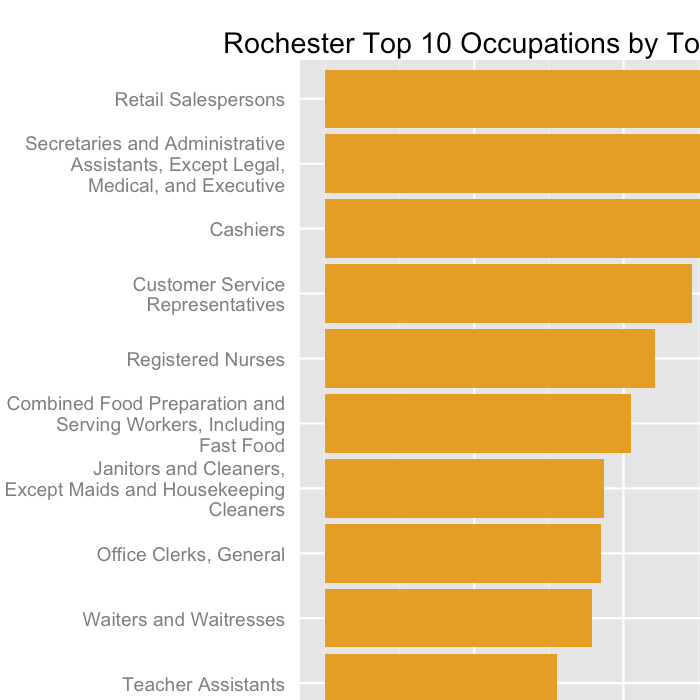
Chris Fenton: Rochester wage data (Shiny, ggplot)
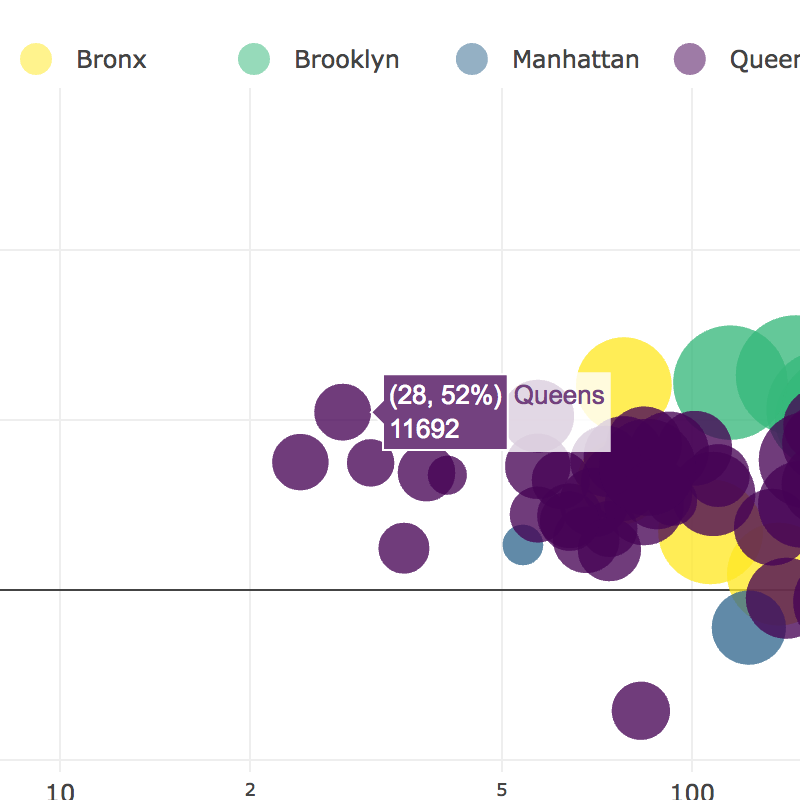
Puneet Auluck: NYC department of sanitation complaints (Shiny, Google Charts)
Dan Smilowitz: Business openings as an indicator of gentrification (Shiny, Plotly)
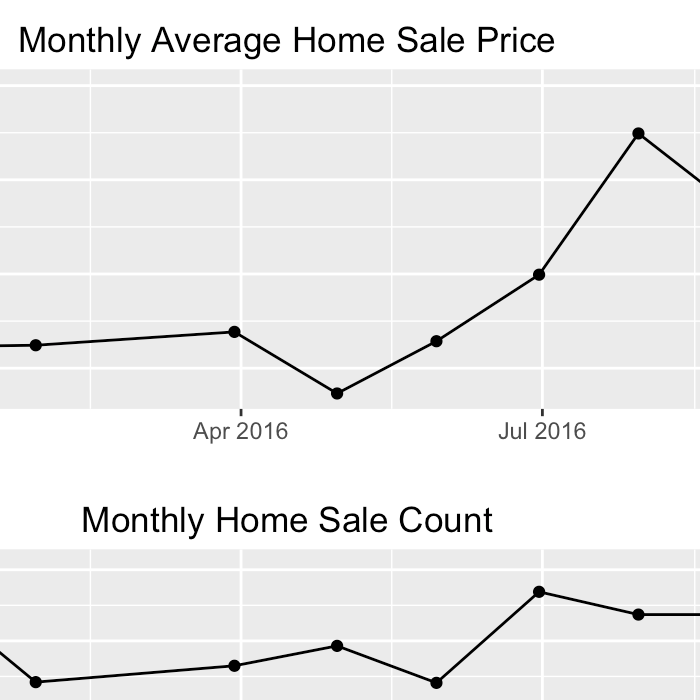
Youquing Xiang: Staten Island home sale explorer (Shiny, ggplot, Leaflet)
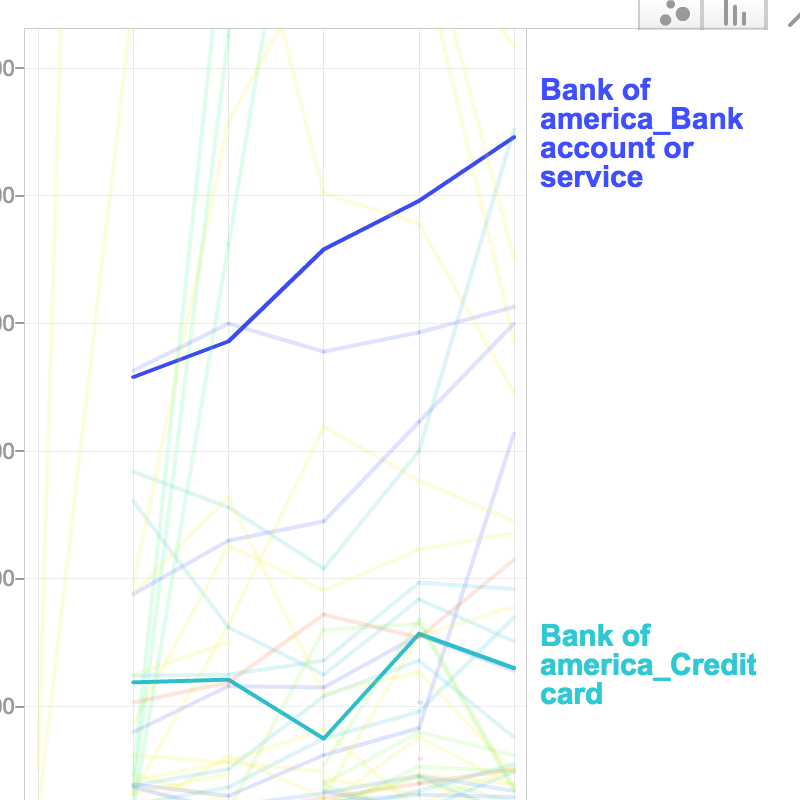
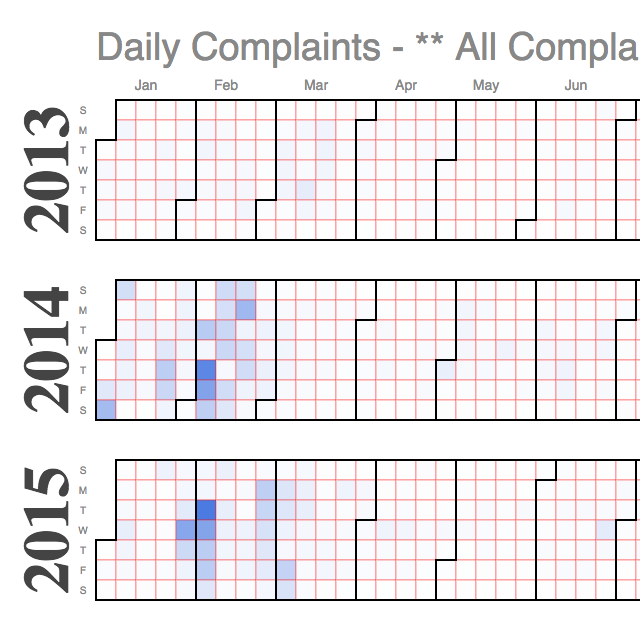
Edwige Talla-Badijo: US consumer complaints (Shiny, Google Charts)
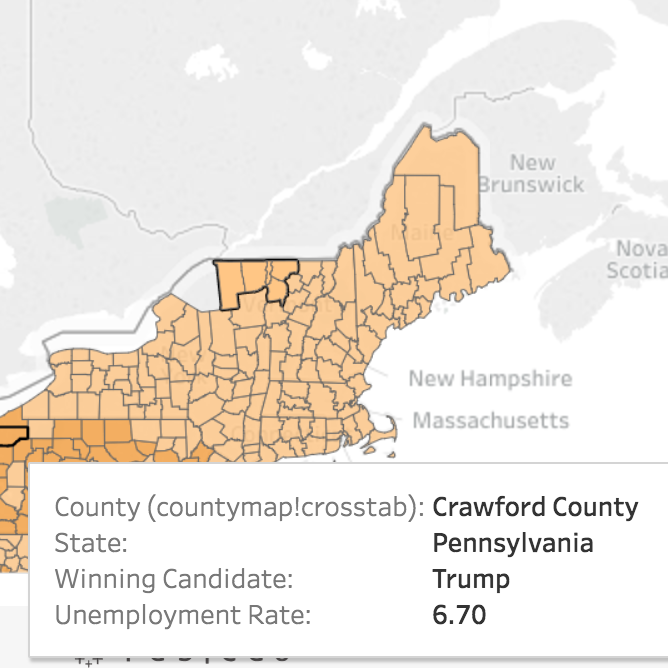
Christina Taylor: 2016 Presidential election results by county (Tableau)
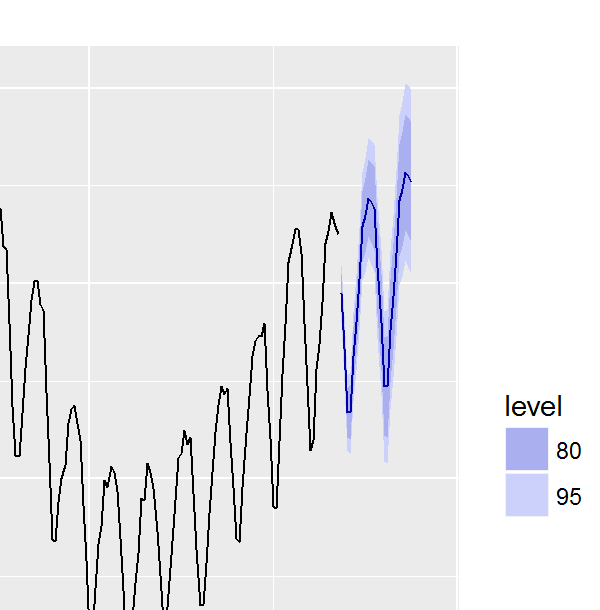
Dan Hong: Forecasting construction spending (ggplot)
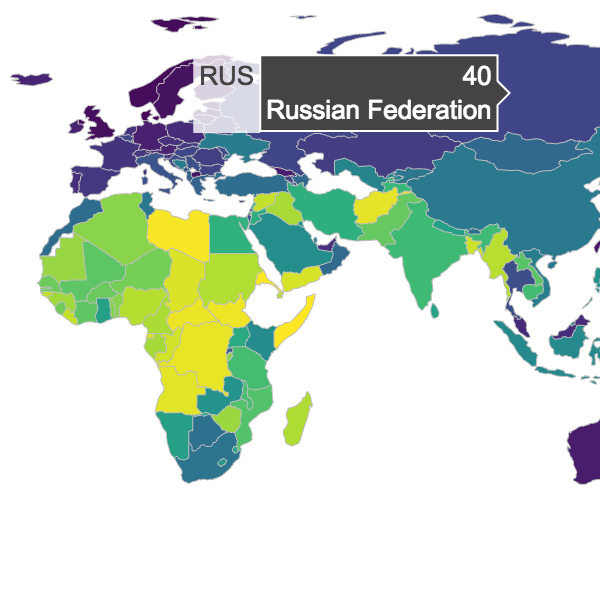
Chirag Vithalani: Ease of doing business (Plotly)
Sanjive Kumar: Midwest demographic analysis (Shiny, ggplot)
Spring 2016
James Hamski: Federal Reserve Bank of New York's Survey of Consumer Expectations (shiny)
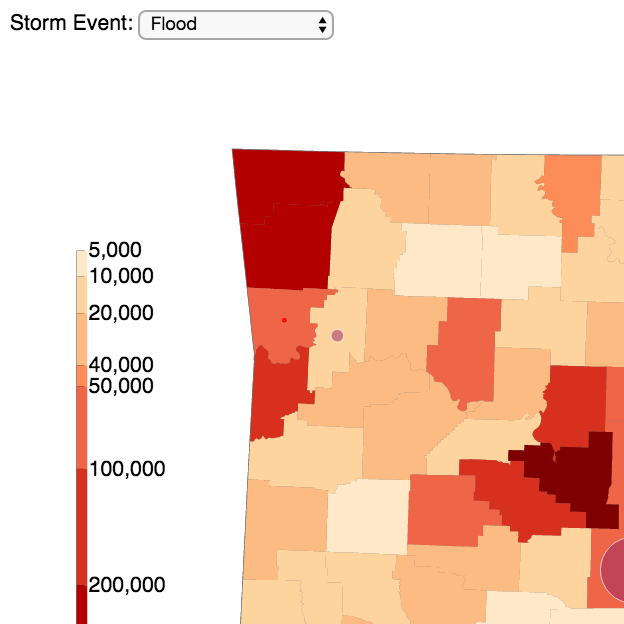
Suman Polavarapu: The Impact of Storm Events (d3, Google Charts)
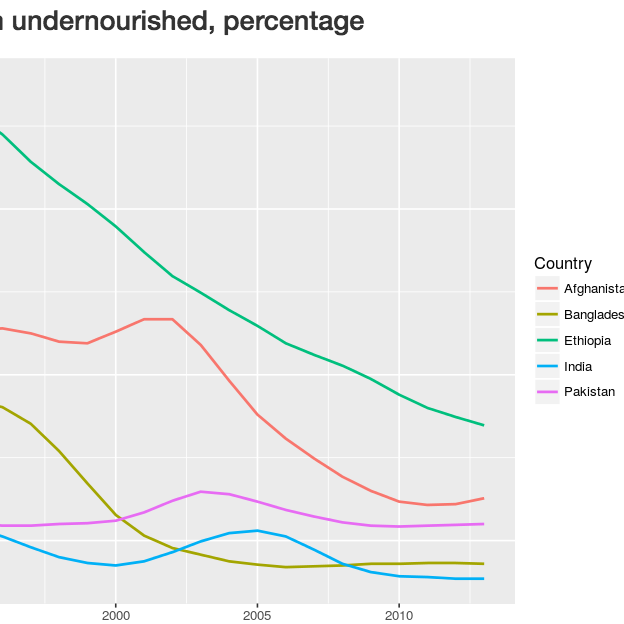
John Deblase: Millenial Development Goals Data Explorer (shiny, Google Charts)
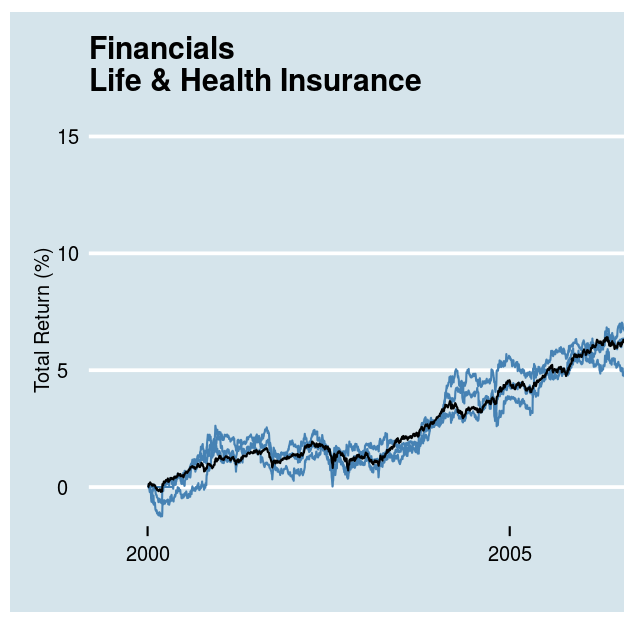
Derek Nokes: S&P 500 Equal Volatility Weights (shiny, plotly)
Nathan Lim: Life Expectancy and GDP (d3)
Mauricio Alarcon: HomeFinder (d3, Google Charts)
Honey Berk: Essex County Assessed Value (shiny)
Daina Bouquin: Visualizing Small Satellite Launches Worldwide (plotly)
Jeffrey Burmood: Atmospheric Water Generation (d3)
Nick Capofari: Staten Island (d3, Google Charts)
Senthil Dhanapal: Credit Card Defaults in Taiwan (ggplot2)
Mohamed Elmoudni: Manhattan Restaurant Inspection Data (Google Charts)
Sonya Hong: US Organic Grain Analysis (Google Charts)
Mohan Kandaraj: Where to Live? (d3)
Shazia Khan: The Burden of US Housing Costs (ggplot2)
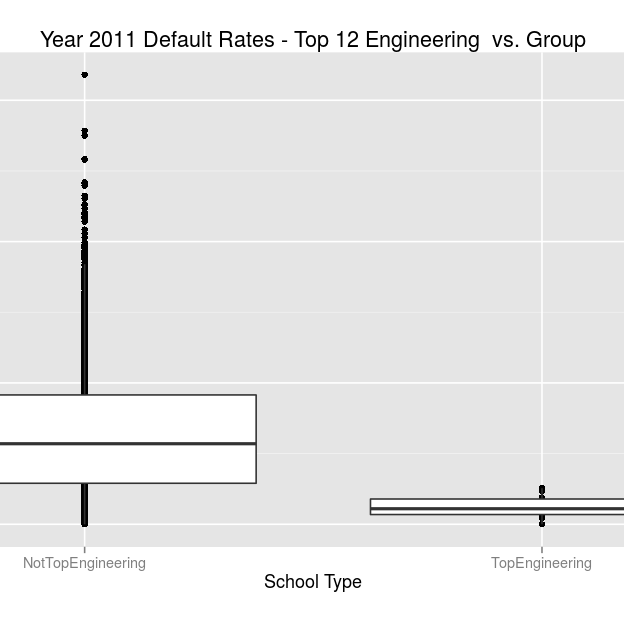
Mike Lennon: Student Loan Default Rates (shiny)
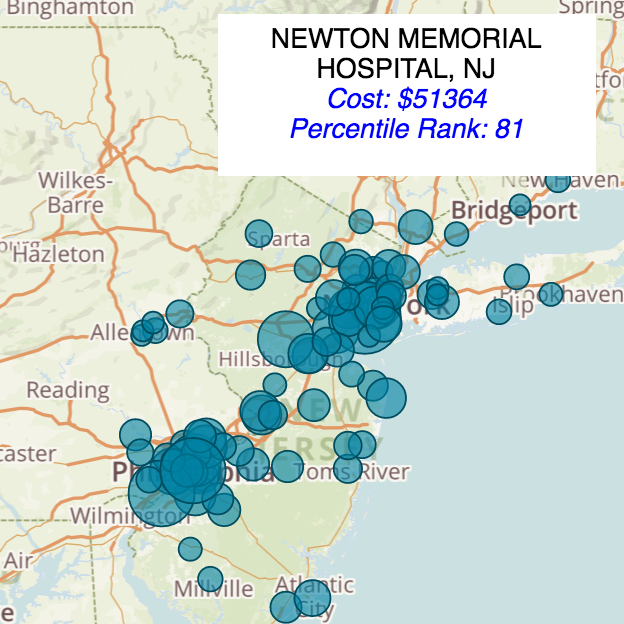
Sekhar Mekala: Hospital Charges Across the US (d3)
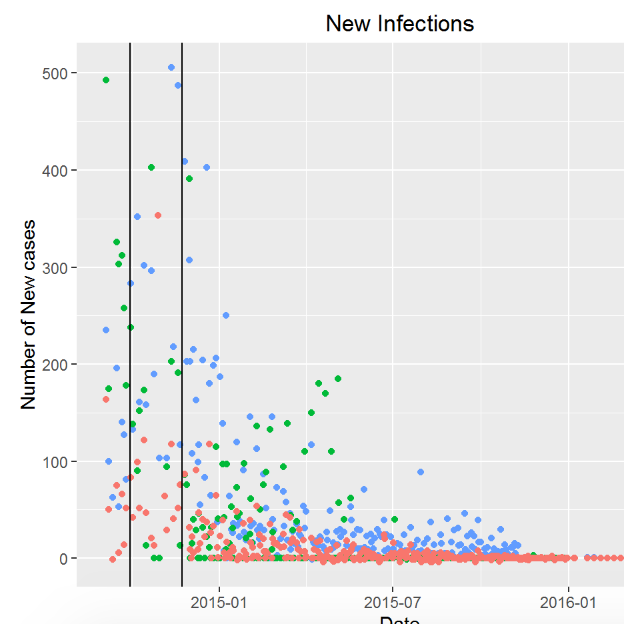
Vuthy Nguy: Current Ebola Situation in West Africa (ggplot2, Google Charts)
Param Singh: NYC Neighborhood Residential Real Estate (d3)
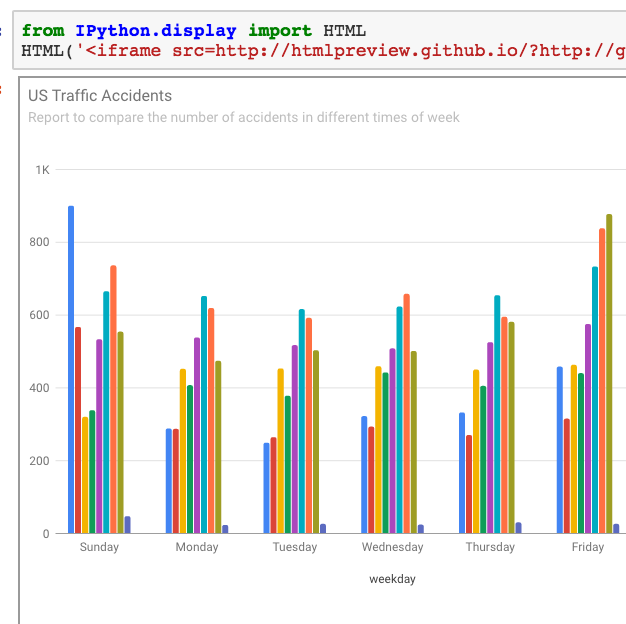
Sreejaya Vasudevannair: US Motor Vehicle Fatality Analysis (Jupyter Notebook, pandas, plotly, Google Charts)
Spring 2015
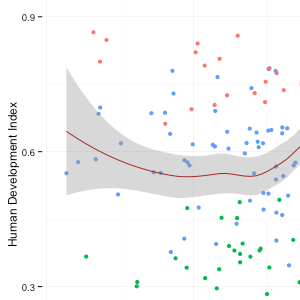
Jay Narhan: Population Density and Human Development Index Scores (d3)
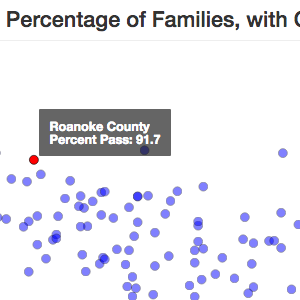
Erik Nylander: Income Effects on Virginia Public School Testing Data (d3)
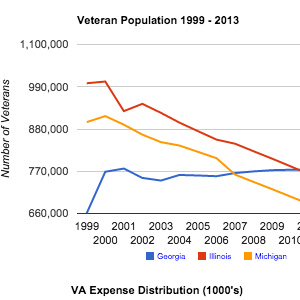
Cheryl Bowersox: US Veterans Administration Expense Analysis (shiny, Google Charts)
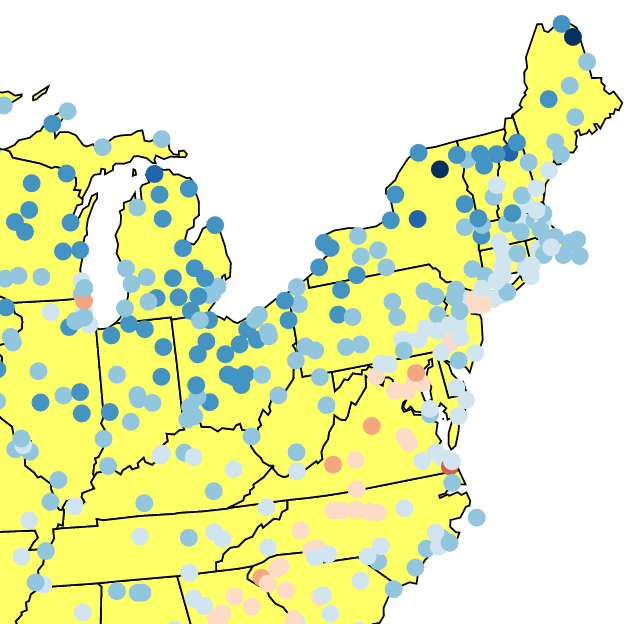
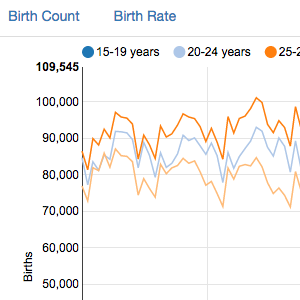
Daniel Dittenhafer: U.S. Natality 2003-2013 (d3, Google Charts)
Tulasi Ramarao: Understanding Terrorism (Google Charts, ggplot2)
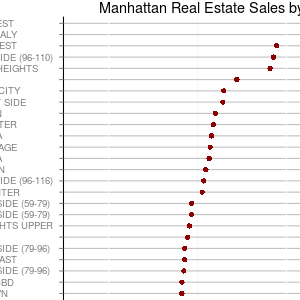
Stacey Schwarcz: Manhattan Residential Real Estate 2003 - 2014 (shiny, ggvis, leaflet)
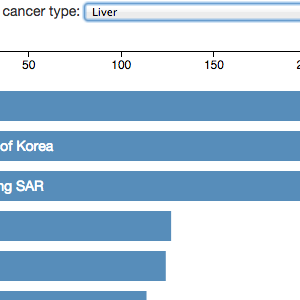
Xingjia Wu: Cancer mortality statistics (d3, Google Charts)
Neil Acampa: Median Annual Income by Race/Education/Year (shiny, ggplot)
Shipra Ahuja: State GDP, House Purchase Affordability & Discretionary Spending in US (shiny, Google Charts)
Igor Balagula: Teachers Turnover and Students Performance (R, d3)
Prashant Bhuyan: Tablet Ratings, Prices at Walmart (Google Charts)
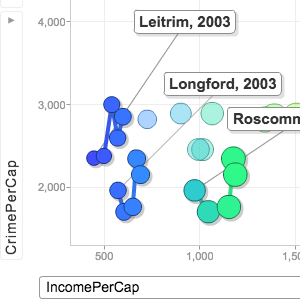
Conor Buckley: Irish Crime Data (shiny, ggplot, Google Charts)
Lara Burford: International Illiteracy (shiny, Google Charts)
Bryant Chang: US State Government Finances (shiny, ggplot)
Riguel Fabre: Auto Fatalities vs. Insurance Rates (shiny, Google Charts)
Charley Ferrari: Company Visit Scores From the Bank of England (d3, Google Charts)
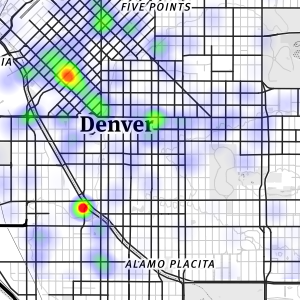
Paul Garaud: Denver Crime Map (leaflet)
Nathan Groom: Freedom Ratings (d3, Google Charts)
Justin Hink: DraftKings and FanDuel Hockey Visualizations (Google Charts, ggpplot2)
Saheli Kar: Immunization, Life Expectancy and Malaria (d3, Google Charts)
Dave Langer: Best US Locations for Data Scientists (d3)
Burton Machado: Effect of mid-term elections on the stock market (shiny, ggplot, d3)
Sandipayan Nandi: Human Mortality (shiny, ggplot, Google Charts, d3)
Dieudonne Ouedraogo: Daily Subway Rides (shiny)
Prashanth Padebettu: US Edu Facts (shiny, GoogleCharts)
Parshu Rath: Statistics of US Businesses (shiny, ggplot, d3)
Alex Satz: FDA Filings by Country (d3)
David Stern: Motor Vehicle Collisions in NYC (Google Maps)
Adejare Windokun: Medicare Payment to Healthcare Providers (shiny, ggplot)
Fall 2014
Student Projects
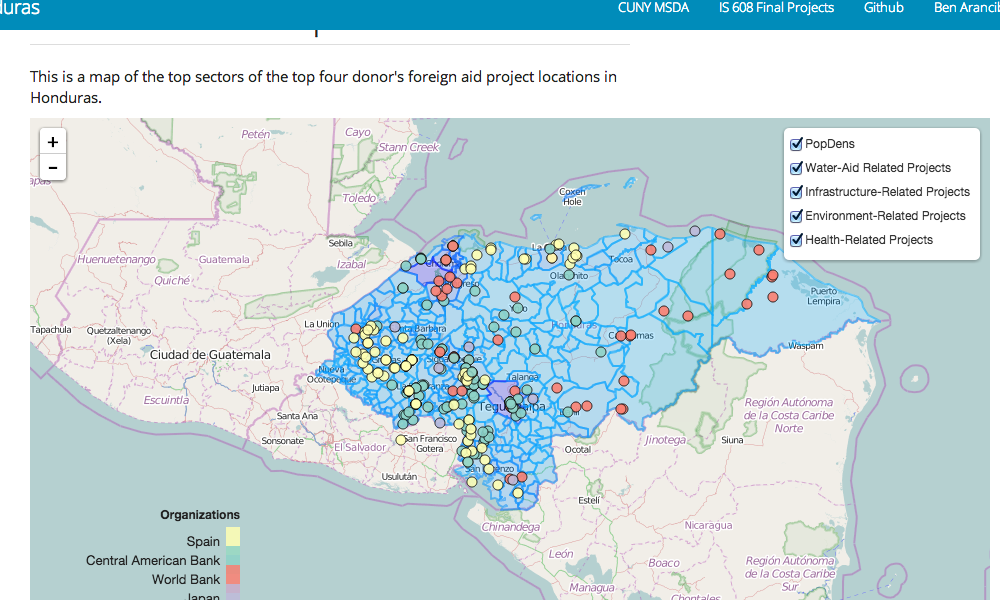
Ben Arancibia: Foreign Aid Projects in Honduras (leaflet, d3.js)
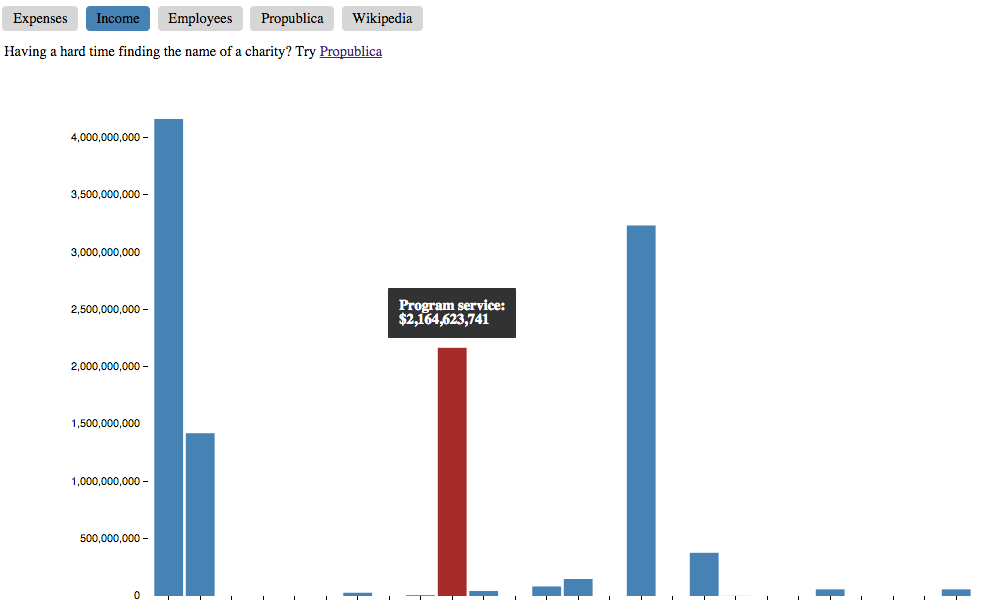
Brett Burk: Nonprofit Financial Information (removed) (d3.js)
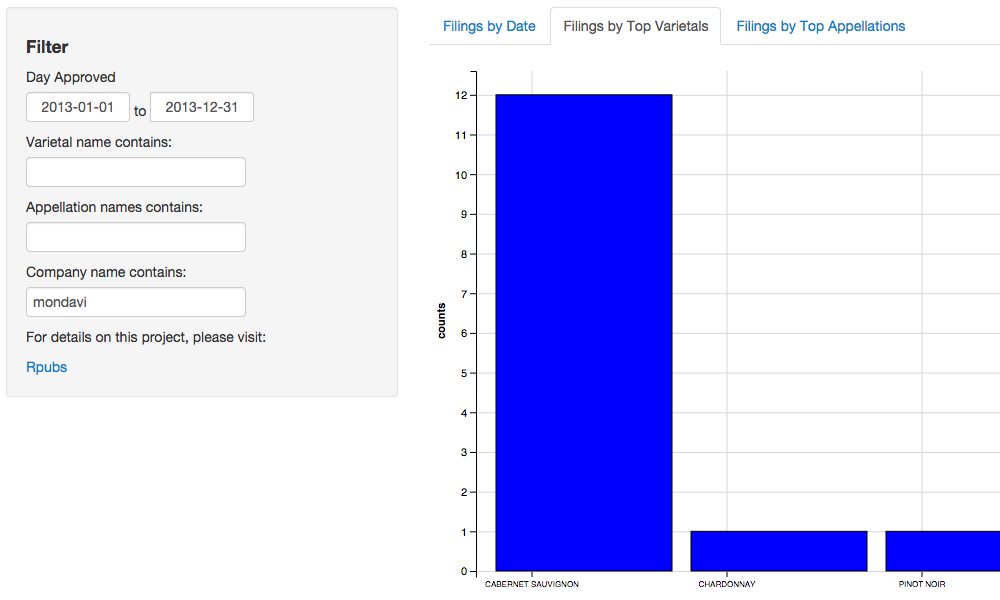
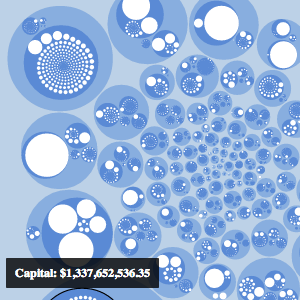
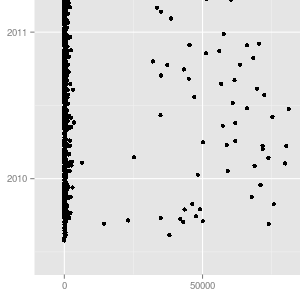
Matt Moramarco: Wine Filing Data Explorer (with writeup here) (ggvis, shiny)
William Chan: State CO2 Emissions (Google Charts)
Spring 2014
Student Projects
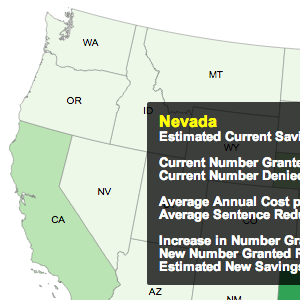
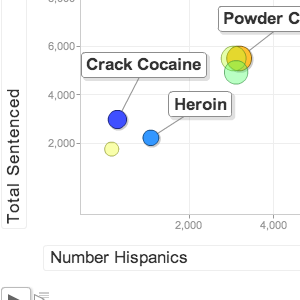
Brian Chu: Visualizing Potential Savings From Applying The Crack Cocaine Fair Sentencing Act (d3.js)
Sharad Gurung: Visualizing Medicare Spending (d3.js)
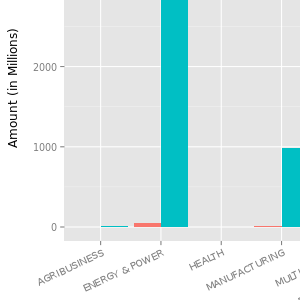
Partha Banerjee: US Trade And Development Agency Funding(shiny, ggplot2, Google Charts) (removed)
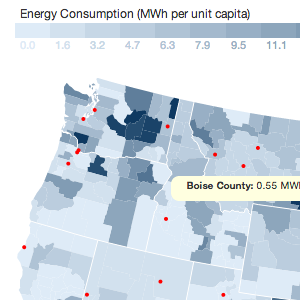
James Quacinella: US Energy Consumption per County (iPython Notebook and d3.js)
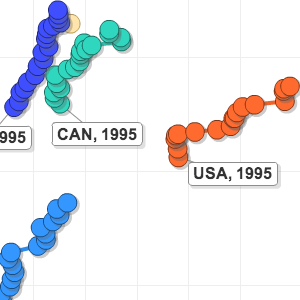
Steve Dunn: Healthcare Expenditure As A Percentage Of GDP (Rmarkdown, Google Charts)
Albania Nicasio: Race and Retroactive Application of the Fair Sentencing Act (Google Charts)
Vincent Ying: Summary of Massachusetts Budget (shiny, ggplot2) Note: Site taken down indefinitely
Rohan Fray: The Cost of Higher Education in the US (ggplot2)
Aaron Palumbo: Massachusetts Budget Accounts (d3.js, Flask, BigQuery) (removed)
Acknowledgements
We were fortunate to have several great people and organizations help us create and host these visualizations. I would like to thank them here for their contributions of time and resources:
- Microsoft, for granting us an Azure academic pass, which is allowing us to host some of the larger projects
- The team at DataKind, in particular Peter Darche, for speaking with us and sharing a number of data sets
- Chris Whong for taking us through his process for creating his amazing visualizations
- Noel Hidalgo of BetaNYC for speaking with us about the power of open data on a local level
- The team running the Master's in Data Analytics program at CUNY, in particular Paul Russo and Andy Catlin, for their support for this project and all of the work we have done
- My former student-turned-TA, Aaron Palumbo, without whom none of this actually would have gotten done.
- And finally, the students: everything you are seeing is their work, with only minor tweaks to get projects online; most of the students started the semester with little or no knowledge of visualization libraries or JavaScript and I could not be prouder of the progress they made this semester
Thank you for your interest in our class's work. If you are interested in the City University of New York's Master's Degree in Data Analytics you may click here, and if you have any questions for me you can contact me via twitter or at [my twitter handle] at gmail
Thanks,
Josh Laurito
City University of New York